
Docko
Job reports and quotes for trades

Crypto, Stock & Forex Signals
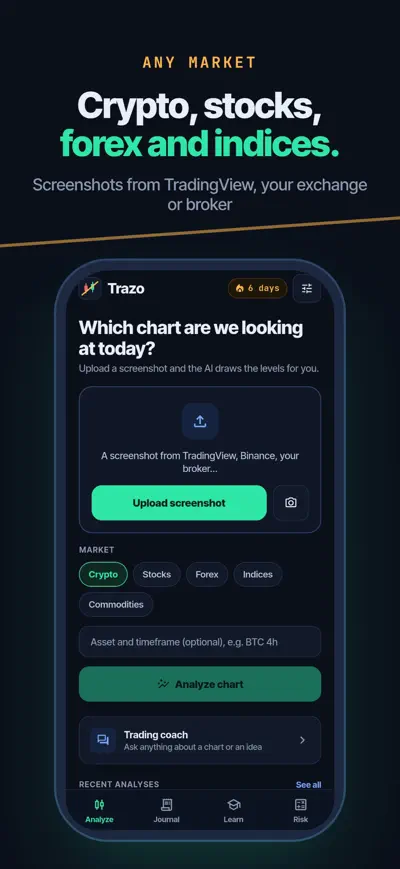
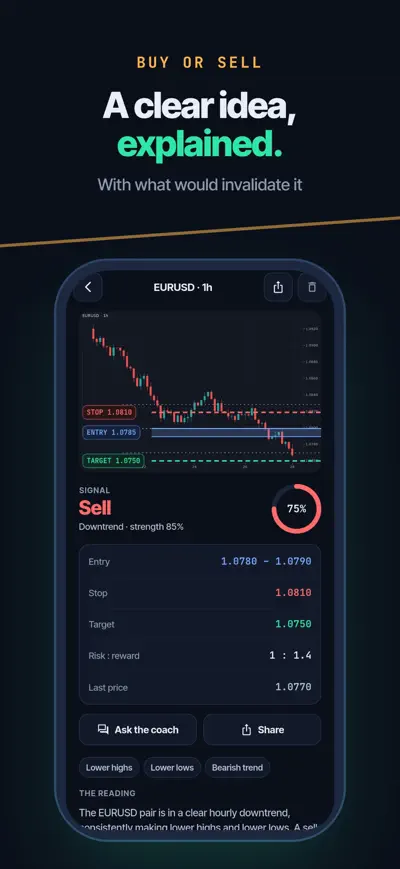
New: the AI draws the entry, stop and target on your own screenshot. Your first analysis is free.
Upload your chart. The AI draws the levels.
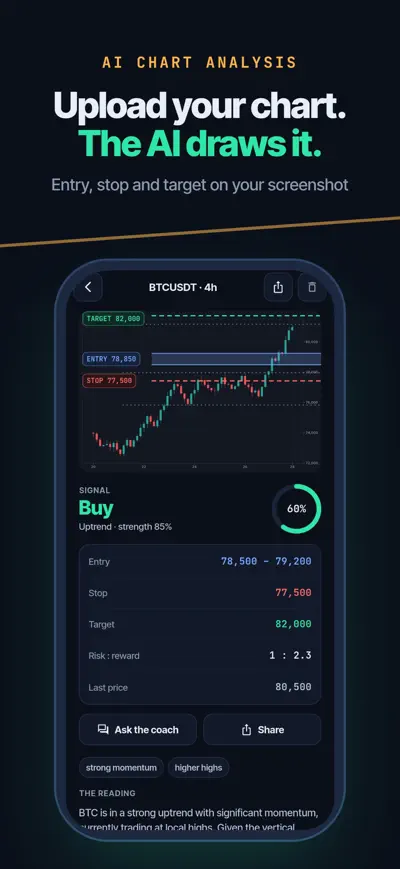
Trazo reads a screenshot of any chart (TradingView, your exchange, your broker…) and draws on your own image the entry zone, the stop and the target, plus the support and resistance it finds. In seconds, explained in your language.
Add up to 3 screenshots of the same asset (1h, 4h, daily) and get one combined reading.
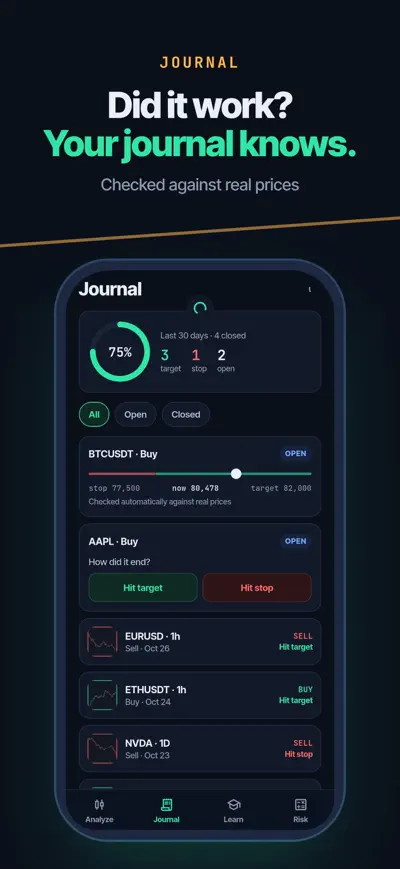
Every analysis goes into your journal. Crypto ideas are checked against real prices automatically; for the rest you mark whether it hit the target or the stop. So you know your real win rate.
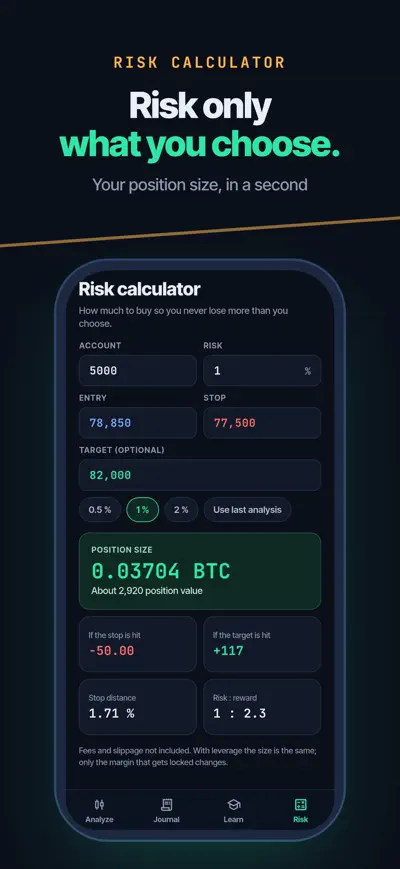
Account size, risk %, entry and stop: Trazo tells you how much to buy so you never lose more than you choose.
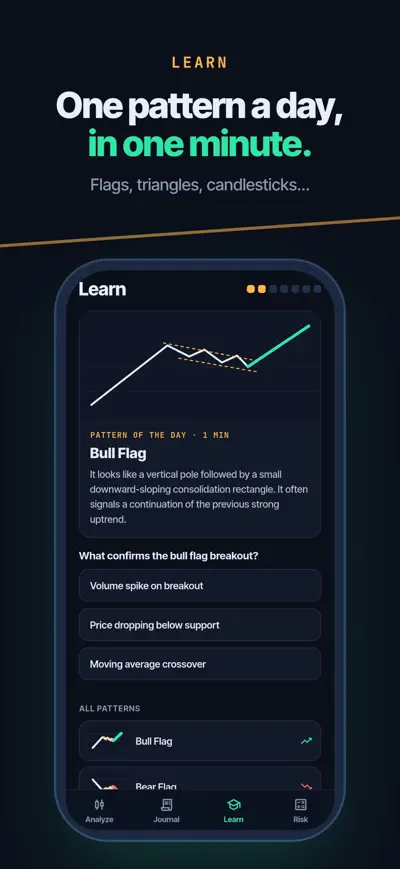
One pattern a day in one minute (flags, triangles, head and shoulders, candlesticks…) with a drawing, a question and your streak.
Ask about any chart, about risk management or about keeping your emotions in check.
It adapts to you: your level and style (scalping, day trading, swing or position) shape the explanations and how far the levels are. A share card for Telegram, Discord or X. 11 languages.
Free: your first analysis (with the levels hidden), the risk calculator and the pattern of the day. Pro: exact levels, unlimited analyses, multiple timeframes, automatic journal and the coach. Weekly (with 3 days free), monthly or yearly. The subscription renews automatically unless cancelled at least 24 hours before the end of the period, from your account settings.
Trazo is an educational tool. Its analyses are made by AI from an image, can be wrong and are not financial advice or an investment recommendation. Trading involves the risk of losing money.
Take a screenshot of a chart in TradingView, your exchange or your broker, open Trazo and tap Upload screenshot. The AI reads the price axis and draws the entry zone, stop and target on your own image.
Use a clean screenshot where the price numbers on the axis are visible, one asset and one timeframe. With Pro you can add up to 3 timeframes of the same asset.
Every analysis goes to the Journal. Crypto ideas are checked against real prices automatically (Pro); for the rest, mark whether they hit the target or the stop.
Settings › Restore, with the same Apple ID or Google account. To cancel, go to your store account's subscriptions.
Settings › Delete my data.
Job reports and quotes for trades

QR menus, translated

Online booking for salons
Digital business card